Best A/B Testing Practices You Need to Know to Increase Conversions

I hope you enjoy this blog post. If you want Hello Bar to grow your leads, click here.
Author:
Ryan Bettencourt
Published
May 1, 2018

A/B testing is all the rage these days, but many entrepreneurs and marketers come up short.
They’re A/B testing their emails, landing pages, sales pages, and other marketing materials, but they don’t glean anything useful from the data.
It’s a common problem. However, there are several ways to fix it, and we’re going to share those secrets with you today.
Best of all, we’re going to share with you some proven case studies along the way. See how major brands and other entrepreneurs have implemented A/B testing to astounding results.
A/B Testing vs Split Testing
You might have heard the terms A/B testing and split testing used interchangeably. They’re actually two different processes.
A/B testing involves comparing two versions of the same thing, with one variable changed. Split testing, on the other hand, involves comparing a control version — such as a landing page that has worked well for years — against several different variations of it at the same time.
Both A/B and split testing can prove useful for your business, but they serve different purposes. Most marketers and entrepreneurs use split testing to compare different designs of a web page or email, while A/B testing is used to identify specific variables that contribute to conversion rates.
A/B Testing Statistics and Significance
You can’t separate statistics from A/B testing. Terms like variance, population, randomness, sampling, and statistical significance are essential to know if you want your A/B tests to prove valid.
But what if you can’t stand math? What if you never took statistics in college? What if the idea of learning an entire field of study triggers your gag reflex?
Marketers are good at one thing: Marketing. Entrepreneurs are good at one thing: Growing their businesses.
If you don’t want to learn statistics to validate your A/B tests, you need a solid automation tool at your disposal. That’s where Hello Bar comes in.
You can test infinite variations of a page on your website, then let Hello Bar calculate the results of the test for you. No math. No calculators. No college preparatory courses.
It’s easy to create two variations (or modals) in Hello Bar, then designate them Variation A and Variation B.

From there, Hello Bar will automatically run A/B testing and show you the results.
What Is A/B Testing in Digital Marketing?

A/B testing is the process by which a marketer tests different elements of a page or document by exposing it to the business’s audience. Two versions of each piece of material are tested at one time, with one variable changed during each test.
It’s sort of like testing recipes. You want to get the perfect combination of ingredients for the final product.
How do you do this? By creating numerous versions of the recipe. One might contain black pepper, while the other doesn’t. Then you test herbs, spices, cheeses, meats, and so on.
Eventually, you arrive at the perfect recipe.
But what if you were to change two things in the recipe? Perhaps you make one version with black pepper and cumin and one without.
You decide that the one with black pepper and cumin tastes better than the control version, but how do you know which spice made a difference?
You don’t. That’s what makes A/B testing so powerful. Instead of testing ingredients, you test marketing elements.
How A/B Testing Works
Let’s say that you want to know what version of a landing page converts the most visitors. That’s easy with an A/B test.
The mockup for your A/B test might look something like this:
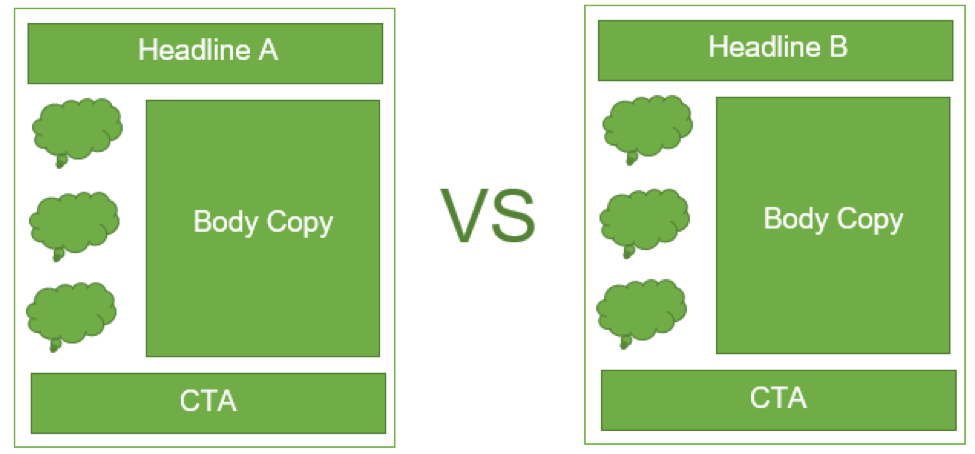
Each version has the same basic elements:
- Headline
- Testimonials along the left side
- Body copy along the right side
- CTA at the bottom
In this example, we’ve chosen to test the headlines. The “A” version has one headline, while the “B” version has another.
Everything else remains the same.
You then deploy both versions of the landing page on your website. Half of your new traffic goes to Landing Page A, while the rest goes to Landing Page B.
Run the A/B test as long as necessary to gather statistically relevant results. Once the trial period ends, evaluate the data. Which landing page performed best?
Why You Should Use A/B Testing Software
It’s possible to manually run A/B tests. That doesn’t mean it’s efficient.
A/B testing software programs, such as Hello Bar, automate the process for you. They automatically show different versions of content to your audience, measure the metrics in which you’re interested, and present you with the “winner.”
It’s that easy. Instead of combing through copious amounts of data, you can sit back and let the software run its course. Armed with the final data, you can immediately launch another A/B test to figure out what other variables contribute to conversions, sales, and other goals.
Hello Bar takes A/B testing a step further, though. It incorporates tons of other useful tools, such as conversion rate optimization, under the same umbrella. Keep testing your web pages while you boost conversion rates, usher visitors toward your social media accounts, and more.
What Can You AB Test?

The great thing about A/B testing is that you can test just about anything. However, what you test falls into two categories: variables and metrics.
Let’s start with variables. These are the elements of a web page, email, or other marketing asset. Variables can be diverse and extremely complex:
- Headlines
- Logos
- Images
- Leading lines
- CTAs
- Testimonials
- Length of page
- Body copy
- CTA buttons
You get the idea. Any design element or piece of copy that you might put on the page can be tested.
Why would you go to that trouble? Because studies have found that the smallest changes, such as altering the color of a CTA button, can have a massive impact on engagement.
Now, let’s turn to metrics. These are the goals you have for a specific A/B test.
Do you want to boost traffic to a specific page? Are you more concerned about conversions? Do you want to increase sales?
Focus on one metric for each A/B test. That way, the data won’t skew based on faulty reasoning.
AB Testing Tutorial
Now that you’re familiar with the logic behind A/B testing and the importance of conducting it, how exactly do you pull it off? Observing every step of the A/B testing process is critical if you want to generate valid data.
There are six basic steps to A/B testing, each of which has equal importance. It’s important to automate everything feasible so you don’t waste time that could be spent on other tasks that require manual attention.
1. Collect Data
It’s a good idea to start with some basic data so you know where you stand. You can get data from Google Analytics, Hello Bar, or any other data collection method or software program you wish.
For the purposes of this tutorial, we’ll assume that you’re hoping to boost conversions through A/B testing. That’s one of the most popular metrics to track.
Using your preferred software program, determine your current conversion rate. It’s a percentage that tells you how many people out of every 100 convert on your offer.
For instance, one study revealed that the average conversion rate for online shopping was 2.95 percent. That sounds extremely low — and it is — but it’s also not uncommon.
By comparison, the top e-commerce sites enjoy conversion rates of up to 30 percent.
It doesn’t matter what your starting metric is, though. The goal is to increase it through A/B testing.
2. Identify Website Conversion Goals
Now that you know your numbers, what’s your goal? Make sure it’s reasonable. If you want to go from a conversion rate of 1.8 percent to 20 percent, you’ll likely find yourself disappointed.
Check out the average conversion rates for your particular industry. How well are the best players in your field converting their website visitors? This is a good place to start.
3. Generate a Hypothesis
As mentioned above, A/B testing comes down to statistics. It’s an exercise in the scientific process. For the scientific process to work correctly, you need a hypothesis.
A hypothesis is an educated guess. You’re positing that, at the end of your A/B test, you’ll have X results. Specifically, you want to guess which version of your landing page or other marketing asset will perform best.
Why does this matter? Because, over time, your guesses will become more accurate. You’ll get to know your audience and what they want, which will enable you to make more informed decisions about design, copy, and other variables.
Write down your hypothesis so you can compare it to the actual results at the end of the A/B test. You might get it wrong — there’s nothing shameful about that. It’s just a baseline from which to begin the test.
4. Create Variations for the A/B Test
Now comes the creative part. Create two versions of the landing page or other asset and change just one variable. For the first test, you might change the headline or the CTA. Pick the element that you think has the most impact on conversions.
Again, you might be wrong, but it’s all part of the process.
For A/B testing, your two variations should be identical save for that one small difference. Otherwise, you’ll contaminate the results because you won’t know which variable caused the difference in conversion rate.
Once you’ve created your variations, push them live with different URLs. Plug them into your Hello Bars so the software can automatically A/B test the variations.
For instance, every new person who visits your website might see a Hello Bar that directs them to Variation 1, while the other half of new visitors will get funneled toward Variation 2.
The goal here is to figure out which of the pages converts best. Hello Bar will work in the background while you carry on with your other duties.
5. Run the Experiment
We’ll talk more about longevity later, but an A/B test needs to run long enough to collect sufficient data. If you don’t have enough data, the test won’t help you boost your conversion rate.
For just a second, we’ll dive into statistics.
You might have heard the term “statistical significance.” It means that, based on the sample size for a study or survey, one can accurately predict future behavior or incidence.
Think about it this way:
If you ask 10 people to choose between two things, you might come up with a five and five split, a seven and three split, or a nine and one split.
There isn’t a large enough sample size to determine that a certain percent of the population prefers one thing or the other.
However, if you ask 100,000 people that same question, a pattern emerges. When 70,000 of them prefer one thing over the other, you can more accurately assume that 70 percent of the remaining population will, too.
Hello Bar will automatically wait until it has sufficient data to present you with a winner. That way, you don’t have to worry about all that statistical significance jargon.
6. Analyze Your A/B Testing Results
When you have a large enough sample for your A/B test, you can either look at the data yourself and determine a winner or let the software do the heavy lifting.
We recommend the latter. Unless you’re a mathematician, analyzing the data manually opens you up to human error. Plus, it’s incredibly time-consuming.
The data should provide you with a clear winner. Sometimes, the results are closer than others. If you find that only a small difference exists between the two variations, you can conclude that the element you tested doesn’t have a huge impact on c.
How Long Should You A/B Test?
One of the questions that marketers often ask is how long to A/B test. There’s no hard-and-fast rule because it depends largely on your audience size.
Let’s say that you sell an extremely expensive SaaS product. Maybe you only get one or two conversions per day (or even per week or month).
Compare those results against an e-commerce site that gets 20,000 transactions per day. You couldn’t say to both of those businesses, “Run an A/B test for three weeks and stop” It doesn’t work.
Hello Bar removes some of the guesswork. Instead of evaluating things like sample size, statistical confidence, and other complex factors, let the software take over the heavy lifting.
After you finalize both versions of your page, you can push them live and let Hello Bar handle the testing phase. The program will declare a winner based on complex mathematical factors.
A/B Testing and SEO
There’s one drawback to A/B testing, but it won’t harm your site or your traffic or Google rankings if you’re careful.
Google penalizes duplicate content. When two pieces of identical content are published on your site, Google doesn’t know which one to present in the SERPs, so it might present neither one.
That’s a problem for any business that wants to generate organic traffic.
Fortunately, Google understands that businesses need to conduct A/B tests. As long as you limit the test run and avoid cloaking (presenting different copy to users and the search engines), you should be fine.
You can also use the rel=”canonical” tag to tell Google which of your variations you want it to crawl. This should be the URL where your landing page or other marketing asset will eventually live permanently.
Furthermore, when you need to redirect search engines, make sure you use 302s instead of 301s. A 301 redirect is permanent and tells Google that you will leave the redirect in place forever. The 302 redirects, however, are temporary.
If you follow those best practices, you won’t have to worry about hurting your SEO through A/B testing.
Common A/B Testing Mistakes
Unfortunately, it’s not hard to make mistakes when conducting your first few A/B tests, especially if you’re using a broader program like Google Analytics. Following are some of the most common mistakes we’ve seen:
- Ending a test mid-week. If you end in the middle of the week, you can’t account for seasonality, such as people spending more time shopping online over the weekend.
- Testing too early. If you don’t have any traffic or conversions, there’s no reason to A/B test. You need a substantial sample size to make the test relevant.
- Testing the same thing over and over. Continuous A/B testing is great, but not when you’re testing the same thing. Trust your data and move on.
- Running multiple tests at once. If you can rule out overlapping traffic, you can conduct multiple tests. Otherwise, stick to one at a time.
Best A/B Testing Tools
The best A/B testing tools eliminate as much of the heavy lifting as possible. Automating your tests will give you more time to focus on other marketing endeavors so you don’t burn out on the A/B tests.
They should also let you A/B test different elements on your website. For instance, you could test different offers, form fields, landing pages, content upgrades, and more from the dashboard.
That’s what Hello Bar provides (but more about that later).
Keep in mind, though, that A/B testing tools abound. Many of them focus on specific elements that you might want to test. For instance, if you’re interested in click tracking, you can’t do better than Crazy Egg.
Hello Bar A/B Testing Examples
Let’s say that you’re interested in A/B testing an offer associated with your email opt-in form. That’s easy enough to do within Hello Bar’s dashboard.
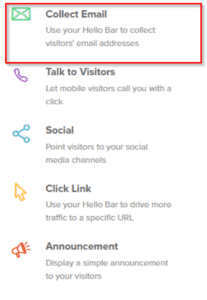
Create a new Hello Bar and select the “Collect Email” option on the left-hand navigation column.
Variation A might look like this:
![]()
Create a second Collect Email Hello Bar. This time, change one of the variables.

For the purposes of our example, we’ll change the CTA on the button to look like this:

As you can see, we haven’t changed anything except the CTA. On a future A/B test, we might want to test the offer. If we leave Variation A the same, variation B could look like this:
Here, we’ve changed the wording on the offer.
From there, you can continue to A/B test different variations until you find the ideal combination of elements.
You can also test CTAs for social media. For instance, test different CTAs to get likes on Facebook.
Start with Variation A. You might want to go with a familiar CTA that everyone will recognize. Half of your visitors will see this Hello Bar.
![]()
Half of your visitors will see this Hello Bar. For Variation B, change up the CTA a little bit.
![]()
![]()
Alternatively, you could test another element entirely. Maybe you want to stick with the original CTA, but change up the Hello Bar’s size.
You can test anything you want, such as animated versus not animated, the colors, or the bar’s placement.
Conclusion
A/B testing is one of the most effective ways to figure out how to boost conversions, traffic, and sales. Fortunately, Hello Bar automates this process so you don’t have to devote hours of time (and mental agility) to the task.
A/B testing involves testing one variation of a marketing asset against another. You change just one variable at a time to keep the data pure.
If you’re not a math whiz, you need an automated solution that will calculate the data for you. That’s easy enough with Hello Bar.
However, you still need to give the test plenty of thought. What does your data look like now? What’s your goal? What do you expect the test to show?
You can then create your variations, run the experiment, and examine the results.
Make sure you don’t let your A/B testing impact SEO. Use 302 redirects instead of 301s, keep tests short and sweet, and use the rel=”canonical” tag.
Additionally, familiarize yourself with the most common mistakes, then learn how to use tools effectively.
Have you conducted A/B tests? What do they show?


